Global demand (Gartner)
565 TWh
Projected global data center electricity demand for 2026 — roughly +26% year-over-year, reflecting rapid AI workload growth.
Research and website maintained by Michael Kowalewski, owner and operator of NovaSynth Labs. This project is independent and not affiliated with the aforementioned companies or corporations.
Facts · Real Progress · Strategic Resilience for Canada & the United States
Transparent data on efficiency gains, clean power, northern advantages, and why keeping critical infrastructure home strengthens us all — long term.
Section 1
Growth in AI-driven computing is real. So are the solutions already underway. A clear look at both is the starting point for good policy and public trust.
Global demand (Gartner)
565 TWh
Projected global data center electricity demand for 2026 — roughly +26% year-over-year, reflecting rapid AI workload growth.
U.S. share
~36%
Approximate U.S. share of global data center electricity use — concentrated demand that makes grid planning and new clean supply essential.
The constructive path
Response
Companies and governments are answering with measurable efficiency gains, dedicated clean generation, nuclear restarts and SMRs, and smart northern siting.
In some communities, rapid cluster growth has strained local grids, water systems, or land-use processes. Those concerns deserve attention — not dismissal. The constructive response is not denial of demand; it is accelerating efficiency, matching new load with new clean supply, choosing cold-climate and low-conflict sites, designing rate structures that protect residential customers, and keeping decision-making transparent so residents can see trade-offs and benefits.
What follows documents published progress on water, energy, rates, nuclear, northern advantages in Canada and Alaska, and supply-chain resilience that keeps critical infrastructure at home.
Section 2
Public concerns often start from a real local worry. Separating documented impacts from broad claims helps everyone focus on solutions that work — without talking past people who are asking fair questions.
Claim
This concern is mostly about localized habitat, light, noise, or construction impacts on specific proposals — for example prairie sites near pollinator habitat, or rare species considerations on or near certain energy campuses. Those project-level issues are real enough to review and mitigate.
There is no credible evidence of broad, industry-wide operational harm to bee populations from data centers. Primary drivers of bee decline remain pesticides, habitat loss, climate stress, and parasites (e.g., Varroa).
Good practice: treat habitat as a design input — landscaping, dark-sky lighting, setbacks, and environmental review — not an afterthought.
Claim
Short-term localized strain can occur where generation and transmission lag demand. That is a planning problem — not a universal law that data centers always raise residential rates.
Independent analysis by Energy + Environmental Economics (E3) finds that well-designed large-load rates can fully cover cost of service; in many cases data centers generate surplus utility revenue that can create downward pressure on other customers’ rates when regulators apply it that way. E3 ratepayer study →
A related E3 synthesis finds no historical evidence that data centers are the primary driver of residential rate increases under existing structures; broader cost drivers often dominate. E3 rate drivers report →
Policy tool: special large-load tariffs (and frameworks such as Oregon’s POWER Act approach) can require big users to pay more of their true cost so residential customers are protected — or even benefit when surplus revenue is shared system-wide. Not a blanket negative.
Claim
Water use has been a legitimate concern in arid regions and older evaporative designs. The published industry response is large and measurable.
Charts and more detail in Real Improvements.
Claim
Construction and permanent jobs, property and other tax revenue, and hyperscaler-funded generation and grid upgrades are documented parts of modern large-load deals — not automatic, but increasingly standard.
Examples: Meta’s Alberta campus funding new generation and grid upgrades for the wider system; Crane Clean Energy Center restart expected to restore hundreds of plant jobs and broader economic activity under a 20-year Microsoft offtake; IceFox’s Indigenous-led northern model pairing data sovereignty with community partnership.
Expanded in Keep It Home and Progress in Action.
Section 3
A common viral claim equates data centers with coal plants on pollution. Local pressures around water, diesel backup generators, and construction mishaps are real and deserve transparent management. The pollution profile of a data center is still fundamentally different from a continuous combustion power plant. Here is a calm, evidence-based breakdown.
Viral claim
“Data centers pollute like coal plants.”
Suggests continuous, plant-scale combustion emissions, toxic ash, and systemic drinking-water contamination as the normal operating mode of digital infrastructure.
Evidence-based picture
Different profile, real local duties
Servers themselves do not burn fuel. Emissions are mainly purchased electricity (grid mix) plus intermittent diesel backup testing. Operational water and waste are regulated; coal plants continuously emit combustion pollutants and produce large volumes of coal ash as core operations.
1 · Air emissions
Data centers
Coal plants (contrast)
Key distinction: diesel generators at data centers are a legitimate siting and permitting issue in dense clusters — and they are not continuous stack emissions equivalent to a coal plant running around the clock.
2 · Water quality
Case study: Cheyenne, Wyoming (2026) — Meta campus under construction
During construction of Meta’s Project Cosmo campus, a contractor (Goat Systems LLC, under general contractor Fortis) discharged fill-and-flush water containing the rare, naturally occurring bacterium Cupriavidus gilardii into Cheyenne’s reclaimed wastewater system — water that is treated and used for irrigation, not the city’s drinking-water supply. No human infections were reported from the incident. The Board of Public Utilities tightened rules (including limits on closed-loop / fill-and-flush discharges to the reuse system), revoked that discharge pathway, and the contractor switched to hauling water off-site. Wyoming Tribune Eagle → The Guardian →
What this was — and was not: a construction-phase industrial discharge into a reclaimed irrigation system that prompted stricter local rules. It was not contamination of the drinking-water supply, and it is not evidence that running data centers routinely dump pathogens into public taps.
Separate the real issues
Direct vs indirect water footprint
Many “data center water footprint” figures include a large indirect share: water withdrawn to cool the thermal power plants that generate the electricity the facility buys. Traditional coal- and gas-fired plants often withdraw far more water per unit of energy for cooling than modern data centers use on-site for IT cooling. USGS thermoelectric water use →
That is why shifting a facility’s power mix toward wind, solar, hydro, and nuclear can cut the total water footprint even when on-site cooling is already efficient — and why comparing only on-site gallons without the power-plant context can mislead.
3 · Carbon intensity
Global electricity share
~1.5%
Data centres accounted for about 1.5% of world electricity use in 2024 (~415 TWh), per the IEA. IEA Energy and AI →
Share of energy CO2
<1.5%
IEA projects data-centre electricity emissions growing yet remaining below about 1.5% of energy-sector emissions through mid-2030s in its Base Case; independent summaries put current CO2 share near ~0.5% of global emissions. IEA → Carbon Brief context →
What drives intensity
Grid mix
Carbon intensity depends on where and how power is generated. Major operators match large shares with renewables and nuclear and fund new clean capacity — including nuclear restarts and offtakes covered in Nuclear & Future Power.
Growth is real and concentrated in some regions; that is a grid-planning and clean-supply challenge. It is not the same as claiming the digital sector already rivals coal generation as a continuous combustion emitter. Matching load with new renewables, nuclear, and efficient northern siting is how intensity falls while capacity rises.
4 · Waste streams
Coal plants
Coal combustion residual waste — coal ash — is generated in large volumes as a direct byproduct of burning coal. It can contain metals and other contaminants and is regulated as an industrial waste stream because of scale and toxicity risks. U.S. EPA — Coal ash (CCR) →
Data centers
Constructive takeaway
Real engineering and siting challenges exist and must be managed transparently: water stress in arid regions, diesel generators in dense clusters, construction-phase discharges, and grid carbon intensity where clean supply lags demand. Those issues call for permits, better cooling design, cleaner backup power over time, and honest community engagement — not dismissal.
None of that makes data centers “as dirty as coal plants.” Continuous combustion, multi-pollutant stacks, and large-volume coal ash are the core operating model of coal generation. Data-center pollution is dominated by the electricity they buy, plus intermittent backup generation and regulated water and waste streams. The industry is rapidly improving water and carbon intensity through free-air and low-water cooling, renewable and nuclear matching, and northern siting — progress documented throughout this site.
Full citations for this section appear under Sources.
Section 4
Efficiency is not a slogan — it is published metrics, fleet upgrades, and cooling redesigns that cut water and energy intensity while capacity grows.
Microsoft
WUE
0.27 L/kWh
Down from ~2.3 L/kWh (~90% reduction)
Amazon
WUE
0.12 L/kWh
~7× better than ~0.84 L/kWh industry avg
Microsoft
Fleet
~90%
Owned fleet on low-to-zero water cooling
Amazon
Water positive
75%
Of the way to water positive by 2030
Liters of water per kWh — lower is better. Microsoft long-run reduction; Amazon 2025 point and industry average for context.
Sources: Microsoft June 2026 · Amazon sustainability
Power Usage Effectiveness — closer to 1.0 means less overhead energy for cooling and facility systems.
Illustrative industry ranges for well-designed facilities using free-air cooling in cold climates vs typical warmer-climate averages.
Raising allowable server inlet temperatures and using outdoor air for free cooling cuts mechanical chilling. Northern climates turn this into a structural advantage: more hours per year when outdoor air cools IT with minimal energy and water. That is why PUE figures of 1.1–1.2 are achievable in cold regions versus 1.3–1.5+ in many warmer markets.
On the bill side, tailored large-load tariffs — minimum demand charges, contribution-in-aid-of-construction, exit fees, and similar tools — are spreading so that growth is paid for by the loads that drive it. E3 and others document how this can protect residential ratepayers when supply is planned alongside demand.
Section 5
Milestones already delivered, and projects moving from announcement to construction and restart — evidence that the constructive path is not theoretical.
After roughly two decades of WUE reduction (~2.3 → 0.27 L/kWh), Microsoft reported achieving water positive status — replenishing more water than it withdrew — while continuing to scale AI capacity. New AI-optimized designs target zero water for cooling in operations.
Constellation’s restart of the former Three Mile Island Unit 1 as the Crane Clean Energy Center (~835 MW) is backed by a 20-year Microsoft PPA. FERC granted a waiver supporting interconnection rights transfer so full deliveries can align with a restart goal in the second half of 2027 (with earlier public timelines also citing 2028). NRC restart oversight continues through dedicated review processes.
Groundbreaking on Meta’s first Canadian campus: about 1 GW, scalable, with closed-loop liquid + dry cooling designed for essentially zero operational water use for cooling (less than a typical golf course). Fully funding new generation and grid upgrades that benefit the wider system; 100% clean/renewable matching.
Indigenous-led, hydro-powered, Arctic-cooled modular campus focused on Canadian data sovereignty and low-carbon northern infrastructure. Project materials describe a fiber backbone and a launch target around 2027 — pairing extreme free-air advantage with community partnership models.
Efficiency win
Cold-climate free air + higher server temperature tolerance delivers industry-leading PUE (1.1–1.2) and lower water intensity where outdoor air does the work.
Ratepayer protection
Large-load tariffs and surplus-revenue designs (documented by E3) help ensure big users cover costs — and can leave residential customers better off when structured well.
Jobs & tax base
Construction peaks, permanent ops roles, and multi-year tax contributions accompany major campuses and nuclear restarts — benefits that compound when projects stay onshore.
Section 6
SpaceX and affiliated projects are advancing three complementary approaches that could materially reduce the terrestrial resource intensity of AI compute while strengthening long-term supply-chain resilience for North America.
SpaceX is developing AI1 satellites, each roughly equivalent in compute to one high-end terrestrial AI rack (~120 kW average / 150 kW peak). Waste heat is rejected directly into space via ~110 m² deployable liquid radiators as infrared radiation — no water cooling required. Continuous solar power in orbit removes dependence on terrestrial grids and water supplies. First prototypes are targeted for early 2027 as part of the broader Starmind constellation vision.
In June 2026 the FTC cleared the acquisition of Mesh Optical Technologies, founded by former SpaceX Starlink optical engineers. Their Alpha C1 transceivers transmit data at up to 1.6 Tbps using light instead of traditional copper/electrical signaling. The result is meaningfully lower power consumption, reduced heat, higher bandwidth, and lower material intensity inside data centers. This “photons over copper” approach improves efficiency for both current terrestrial facilities and future orbital systems.
The joint Tesla/SpaceX/xAI Terafab initiative is building advanced semiconductor manufacturing capacity, including radiation-hardened D3 processors optimized for space and high-reliability environments. This vertical integration reduces dependence on constrained external supply chains and supports optimized silicon for both orbital and terrestrial AI infrastructure.
Note: Terafab semiconductor initiative announcements (2026); primary public filings and company briefings as available.
Together, orbital compute (no terrestrial water or grid draw for the IT load itself), photonic interconnects (lower power and heat inside the rack), and domestic custom silicon (supply-chain and design control) extend the same “real improvements” story beyond today’s facilities — into approaches that could ease pressure on land, power, and water over the longer term while keeping critical capability in North America.
Section 7
Alongside large campuses and emerging orbital systems, some operators are testing whether spare household electrical capacity can host compact, professionally managed AI nodes — an early-stage model that should be weighed on engineering and pilot evidence, not hype.
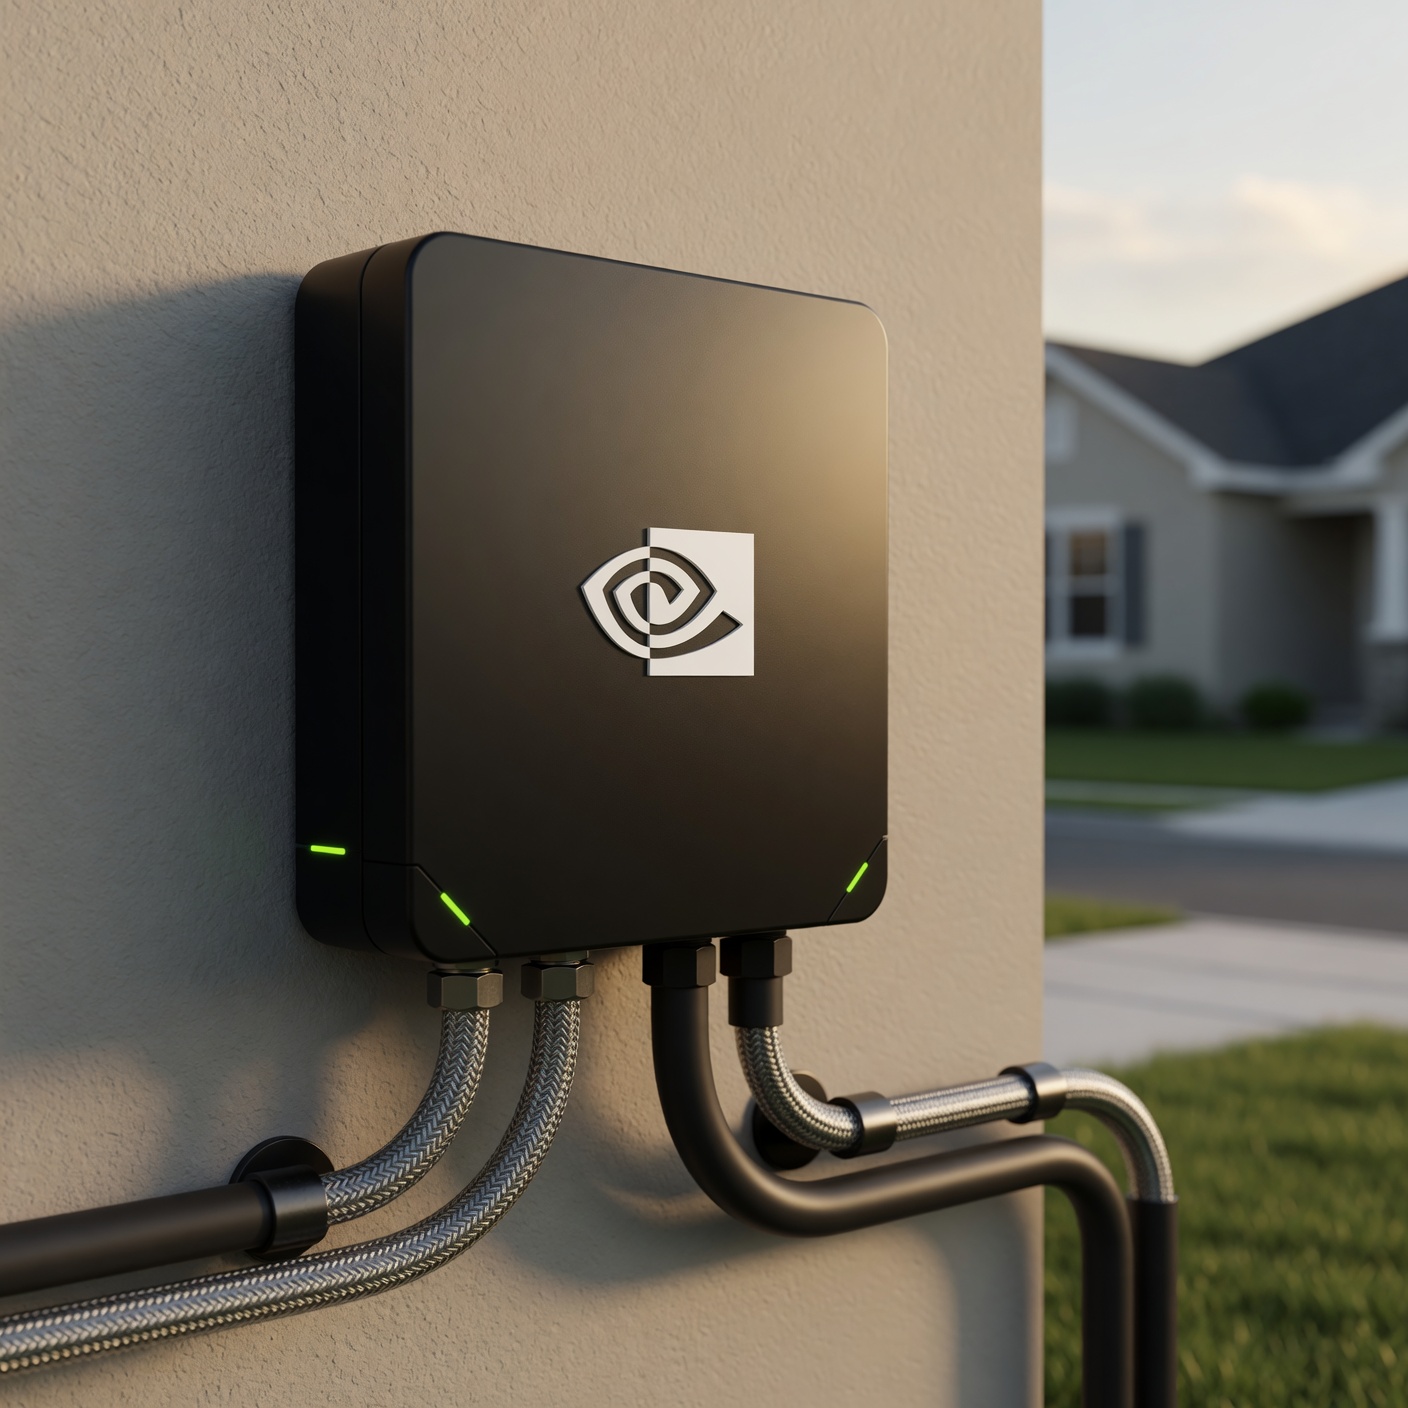
In 2026, startup Span partnered with NVIDIA and homebuilder PulteGroup to deploy compact “XFRA” nodes. Each unit is roughly the size of a residential HVAC condenser and contains 16 liquid-cooled NVIDIA RTX Pro 6000 Blackwell Server Edition GPUs, 4 AMD EPYC CPUs, and 3 TB of memory. The design aims to draw on spare electrical capacity already present in many homes, using Span’s smart panels and a battery system rather than a dedicated utility feed for a hyperscale campus.
Initial focus is new residential construction. A roughly 100-home pilot is planned for 2026, with longer-term targets described in tens of thousands of nodes if the model proves workable in practice.
These are stated program goals from public coverage of the 2026 pilot announcement — not independent performance guarantees. Real-world economics will depend on utilization, grid rules, and maintenance outcomes. Image is illustrative of scale and placement, not an official product photo.
Exterior mounting creates visible, high-value hardware that could raise theft and vandalism concerns in some neighborhoods. Placement inside a basement or dedicated utility room — near existing mechanical systems — would likely reduce physical security risks, improve aesthetics, and make maintenance access cleaner. Because the units are liquid-cooled and heavily enclosed, noise is expected to be low — potentially comparable to or quieter than a typical residential furnace. As with any early-stage distributed infrastructure model, questions around long-term maintenance responsibility, hardware refresh cycles, insurance, and actual homeowner experience remain open and will need real-world data from the pilot.
Like orbital and photonic efforts elsewhere on this page, residential AI nodes are one more practical experiment worth tracking: they explore ways to expand compute capacity while reducing some of the traditional frictions of large-scale data center siting — land assembly, multi-year power delivery, and concentrated local opposition — without claiming the model is mature yet.
Section 8
Reliable, clean baseload is returning to the center of the strategy. New capacity adds supply, reduces long-term grid pressure, and enables flexible siting — including remote and northern locations.
Factory-built, containerized, road-transportable designs are especially relevant for remote or northern deployment — shorter construction timelines, smaller footprints, and multi-year fuel lives in many concepts.
X-energy XENITH & related concepts
Advanced modular designs oriented toward flexible industrial and remote power use cases.
Westinghouse eVinci
Heat-pipe microreactor concept: transportable, multi-year fuel life, suited to remote industrial loads.
Typical design envelope
3–10+ MWe class units with multi-year to ~20-year operation concepts without refueling — ideal companions for modular northern campuses.
Positive framing: Nuclear restarts, SMRs, and microreactors do not merely “feed data centers.” They expand clean firm supply for the whole system, reduce the risk that AI growth outruns local grids, and open siting options where long transmission lines are expensive or slow. That is long-term resilience — not a short-term workaround.
Section 9
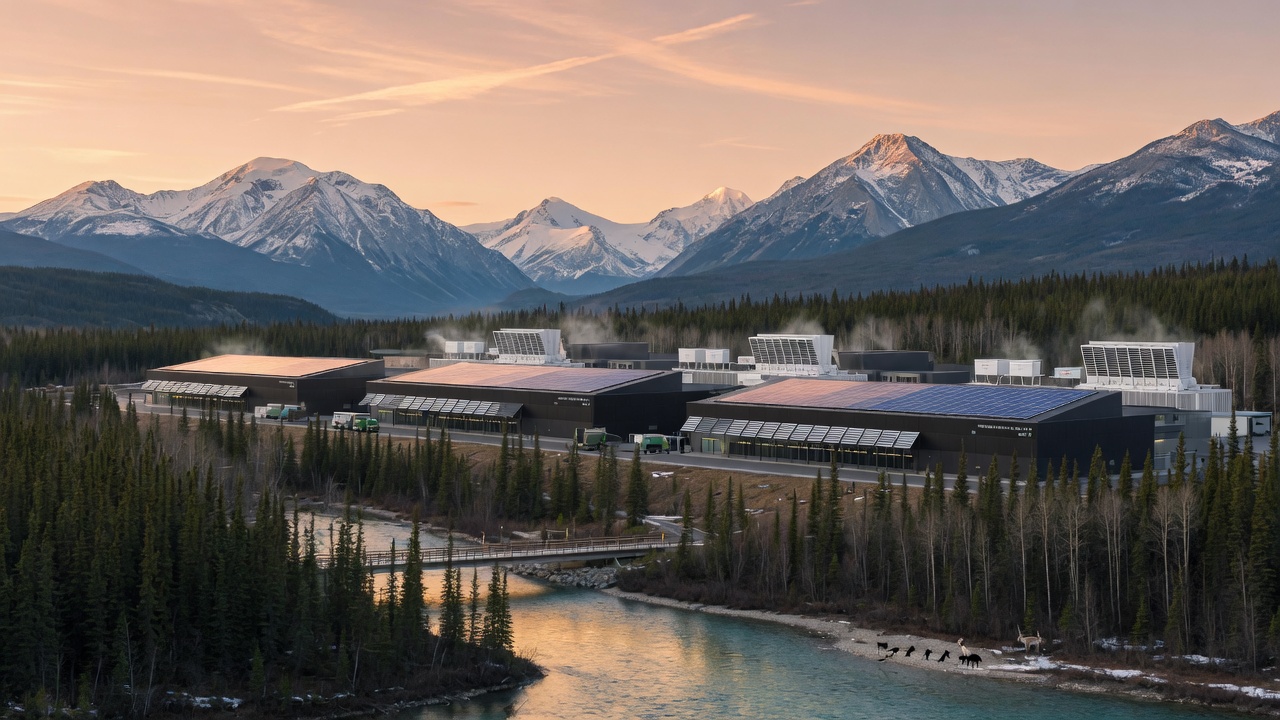
Cold climate is a strategic superpower. Yukon, Northwest Territories, the Rockies corridor, Alaska, and cold Canadian cities turn free-air cooling into months of low-cost, low-water operation — with hydro and clean power matching where geography allows.
Free-air cooling
6–8+
Months of free-air potential in many northern regions (e.g., Winnipeg, Montréal-class climates and colder)
Industry-leading PUE
1.1–1.2
Achievable in cold climates vs 1.3–1.5+ in many warmer regions — major electricity and cost savings
Dual benefit
Power + Water
Less mechanical cooling energy and far lower evaporative water use when outdoor air does the work
Conceptual map highlighting cold zones, hydro-rich corridors, and illustrative project locations.
Not to scale · Schematic for education
Indigenous-led, Arctic-cooled, hydro-powered modular campus targeting ~2027 with fiber backbone. Canadian data sovereignty + low-carbon northern infrastructure.
icefoxdatacenter.ca →~1 GW, groundbreaking announced; zero operational cooling water; funds new generation & grid upgrades; 100% clean matching.
Meta announcement →Concepts leveraging extreme natural cooling in already-industrialized remote areas — pairing climate advantage with existing logistics corridors.
Section 10
Minerals themselves are often not rare. The bottleneck is processing and refining capacity — historically concentrated in a small number of jurisdictions. Diversifying that capacity across Canada and the United States is a strategic project for AI, defense, semiconductors, and clean tech — and it pairs with keeping compute capacity itself onshore.
Construction and permanent operations jobs; multi-year property and other tax revenue; hyperscaler-funded local infrastructure (roads, fiber, substations) that outlasts a single project phase.
Hyperscalers increasingly fund new dedicated generation and grid upgrades that improve reliability for the wider system — matching load with supply rather than only competing for fixed capacity. Nuclear restarts (e.g., Crane) add firm megawatts for everyone on the same grid.
Especially valuable for Canada: keeping Canadian data under Canadian jurisdiction where possible, with domestic operators and northern sovereignty-focused projects (e.g., IceFox) strengthening control over sensitive workloads.
Reduces dependence on foreign processing and compute capacity, and vulnerability to export controls, blocking, or leverage by other powers. USMCA partners and G7 critical-minerals coordination are practical tools — not slogans.
Cold-climate siting + efficiency gains + new clean and nuclear firm power reduce the very pressures (energy, water, land conflict) that concern communities. Keeping capacity home under high environmental standards is often better for the planet than offshoring to jurisdictions with weaker rules or dirtier grids.
Section 11
Short-term offshoring or fear-driven delays may feel easier. Investing in North American (Canada + United States) capacity, northern advantages, domestic processing, and clean reliable power — including nuclear and microreactors — delivers better outcomes across environment, political resilience, technological progress, and genuine public trust.
The evidence path is clear: demand is rising; water and energy intensity are improving rapidly; clean firm power is being rebuilt; cold northern regions offer structural advantages; well-designed rates can protect residential customers; and secure supply chains reduce strategic vulnerability. None of that requires dismissing public concerns. It requires answering them with transparency and delivery.
Environment
Cold siting, free air, dry/closed-loop cooling, water-positive goals, and new clean firm power cut intensity even as capacity grows.
Economy
Jobs, tax base, and hyperscaler-funded grid and generation investments that strengthen host communities for decades.
Security
Data sovereignty, onshore processing, and resilience against foreign leverage over compute and critical minerals.
Grid fairness
Large-load tariffs and surplus-revenue designs so growth pays its way — and residential customers are not left holding the bag.
Technology
AI and cloud capacity built where we can innovate on efficiency, nuclear, and modular northern campuses at the frontier.
Public trust
Open data, real sources, and projects that deliver measurable water, carbon, and community outcomes — not spin.
Share the facts
Help influencers and communities use verifiable numbers instead of viral fear.
Support evidence-based policy
Back siting, grid, nuclear, tariffs, and critical-minerals policy grounded in data.
Build responsibly at home
Long-term strength comes from capacity we control and improve together.
Software discipline
Efficient (“green”) coding practices reduce unnecessary processing cycles and lower power draw at the software layer. That cuts energy demand in the facility — and, by reducing thermal stress on chips and systems, can also extend hardware lifespan. Alongside facility efficiency, clean power, and frontier hardware, software discipline is a practical lever for long-term sustainability.
Frontier industries are already making meaningful strides in reducing the resource intensity of large-scale compute. Beyond efficiency gains in existing facilities, new approaches in orbital systems, photonic interconnects, and custom silicon are emerging that could meaningfully ease pressure on terrestrial power, water, and land resources over time. These parallel paths of hardware innovation and software discipline both matter for long-term sustainability.
Facts over fear. Innovation over paralysis. North America, long term.
Transparency
This page synthesizes publicly reported company sustainability metrics, government critical-minerals announcements, project disclosures, regulatory updates, and independent analyses (including E3). Figures are rounded for readability; always consult primary documents for decision-making. Projections (e.g., Gartner demand) are scenario estimates, not guarantees. Illustrative PUE ranges reflect commonly reported cold-climate vs warmer-climate performance, not a single universal standard. All links below open the original sources.
Primary sources for the Pollution Claims section (Cheyenne incident, generator permits, carbon intensity, water context).
Open source & free hosting
Pure static HTML/CSS/JS. Compatible with GitHub Pages, Netlify, Cloudflare Pages, and similar free hosts. No backend, no logins, no ads, no tracking subscriptions.
This site is open source. Data is public and verifiable. Built to inform, not to divide.